Tell us about the job
Takes about a minute. No obligation.
A contractor quoting a heat pump installation in Burke County has to account for what the climate here actually asks of the equipment year to year. 102 severe weather events were recorded in Burke County, Georgia between 2015 and 2024. That puts this county in the middle of the national distribution, which means severe weather is a real but not dominant factor in how hard a system has to work. The local sizing question is therefore driven as much by the building itself, duct layout, and installation quality as by outdoor conditions, and a contractor who skips that calculation will leave the system running harder than it should from the first day.
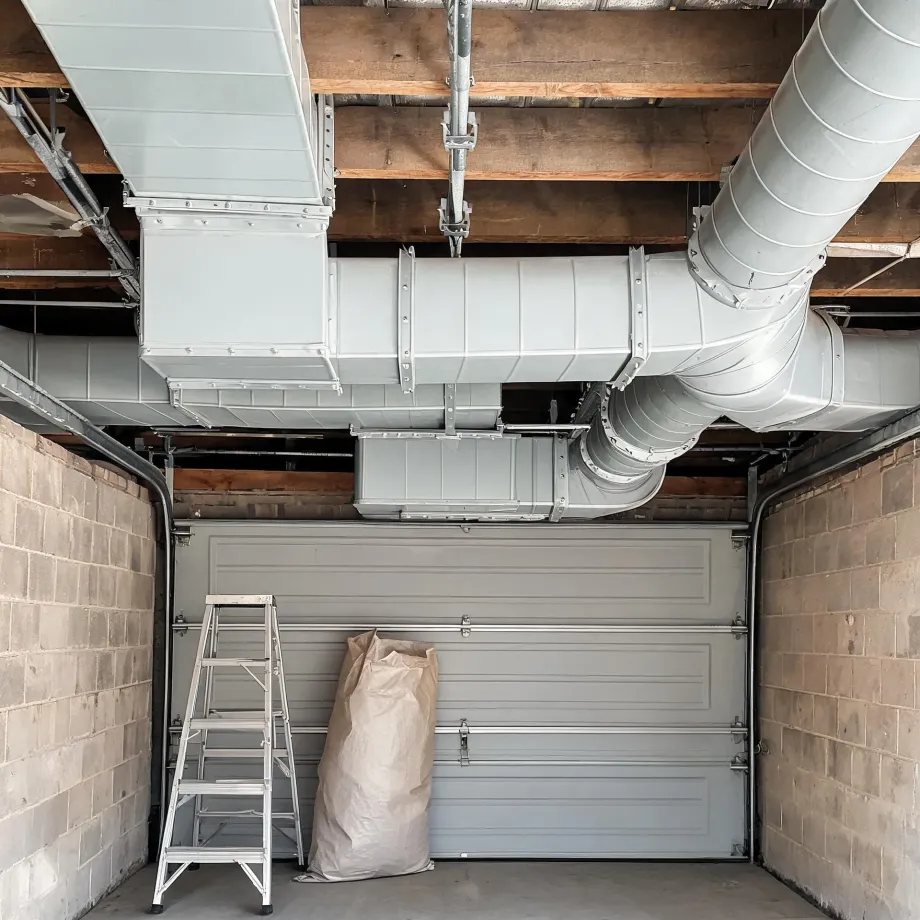
Ductwork designed around a different kind of system shapes what a heat pump installation actually requires here. Half the homes in Burke County, Georgia were built in 1982 or earlier (2020-2024 ACS 5-year). That gap between when these houses were built and what contractors are now putting in them is where sizing and airflow calculations get complicated, because the duct runs may not move air the way a heat pump needs. Electrical service gets checked too, but it is the existing duct layout that a contractor has to measure and model before the equipment choice is final.
What a Heat Pump Installation Covers
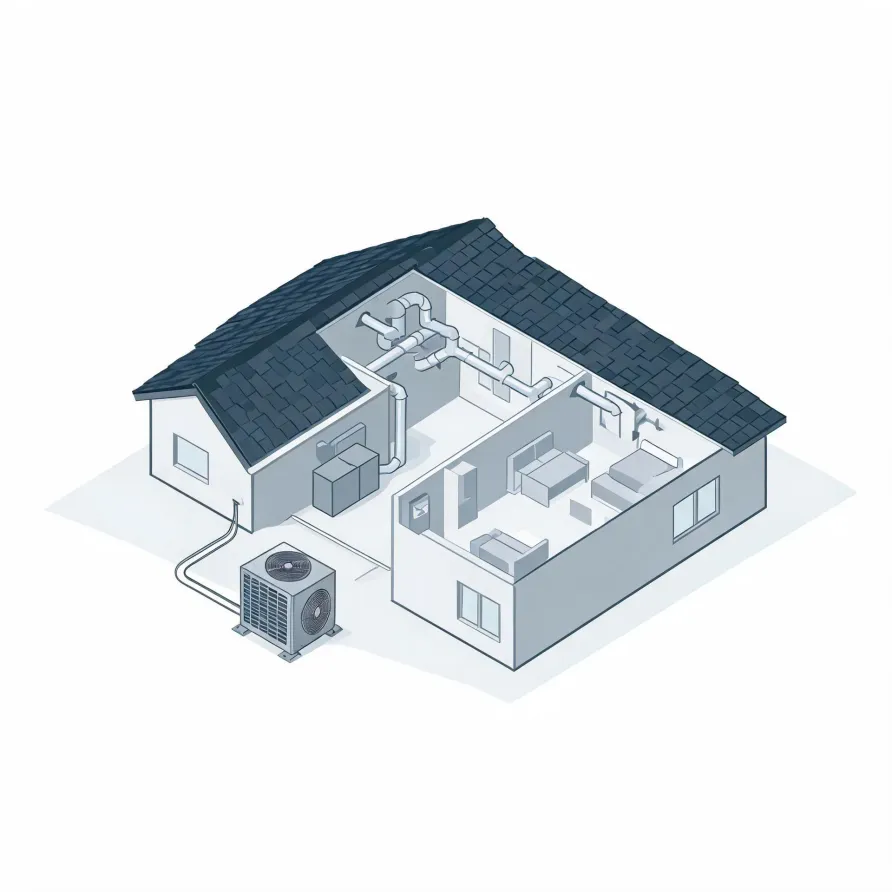
The outdoor unit sits on a pad beside the house and holds the compressor and the coil that exchange heat with the outside air. Inside, an air handler or indoor coil mounts in a mechanical closet, attic, or utility space and moves conditioned air through the home. These two units are the core of what a contractor installs.
A refrigerant line set runs between the outdoor and indoor units, carrying refrigerant through insulated copper tubing that the contractor routes along the exterior wall or through the building structure. A thermostat mounts on an interior wall and gives the household control over when and how the system runs.
The drawing shows a typical layout, and a licensed contractor determines exactly what applies to this house.
Get matched in Burke CountyBurke County by the numbers
102 severe weather events were recorded in Burke County, Georgia between 2015 and 2024.
NOAA National Centers for Environmental Information, Storm Events Database, bulk CSV export, events 2015-01-01 through 2024-12-31.Half the homes in Burke County, Georgia were built in 1982 or earlier (2020-2024 ACS 5-year).
U.S. Census Bureau, 2020-2024 American Community Survey 5-Year EstimatesBurke County, Georgia holds 11,300 housing units (2020-2024 ACS 5-year).
U.S. Census Bureau, 2020-2024 American Community Survey 5-Year EstimatesOwners occupy 70.0% of the occupied homes in Burke County, Georgia (2020-2024 ACS 5-year).
U.S. Census Bureau, 2020-2024 American Community Survey 5-Year EstimatesSevere Weather Events in Burke County
Weather patterns shape how hard a heat pump has to work and for how long. What this county sees over time is part of what determines the right equipment and how it holds up once installed.
102 severe weather events, 2015–2024. Source: NOAA National Centers for Environmental Information, Storm Events Database.