Tell us about the job
Takes about a minute. No obligation.
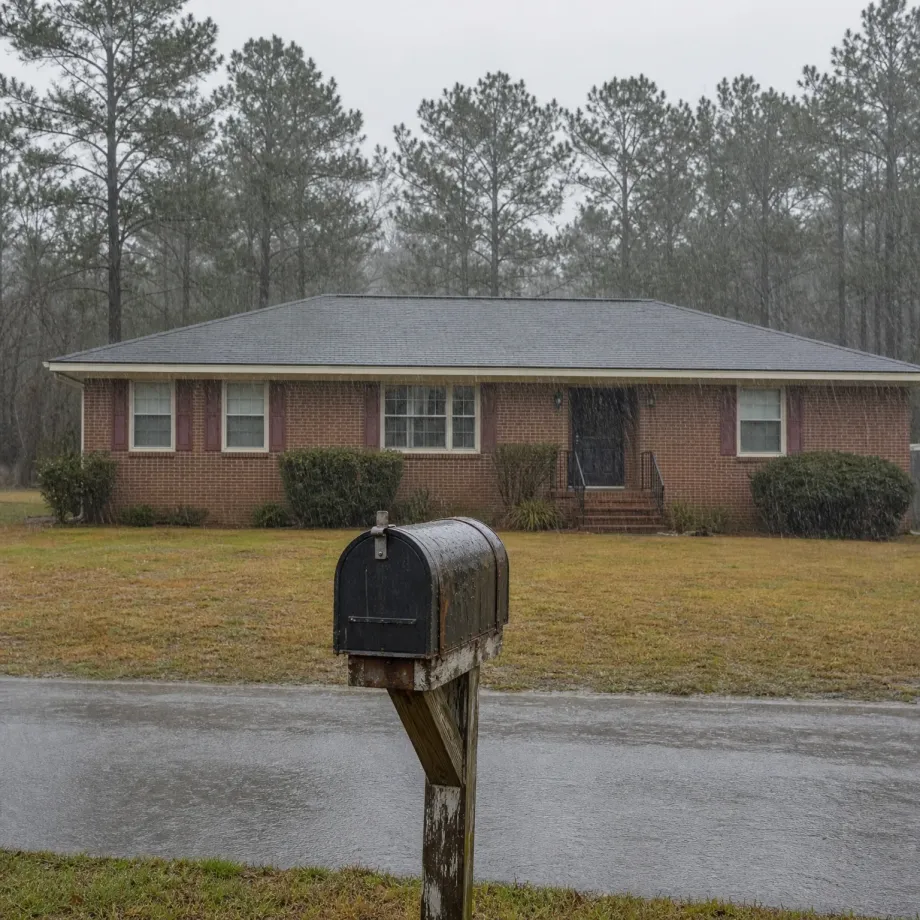
A heat pump installation in Walton County is a local sizing problem before it is anything else. 191 severe weather events were recorded in Walton County, Georgia between 2015 and 2024. At that rate, severe weather is a standing condition that a contractor has to account for when selecting equipment capacity and specifying how the unit is mounted, sealed, and connected to the structure. A system installed without that load in mind will run harder than its specs assume, and the wear that follows starts early. The contractor's job at the quote stage is to match the equipment to the actual climate the unit will spend its life in.
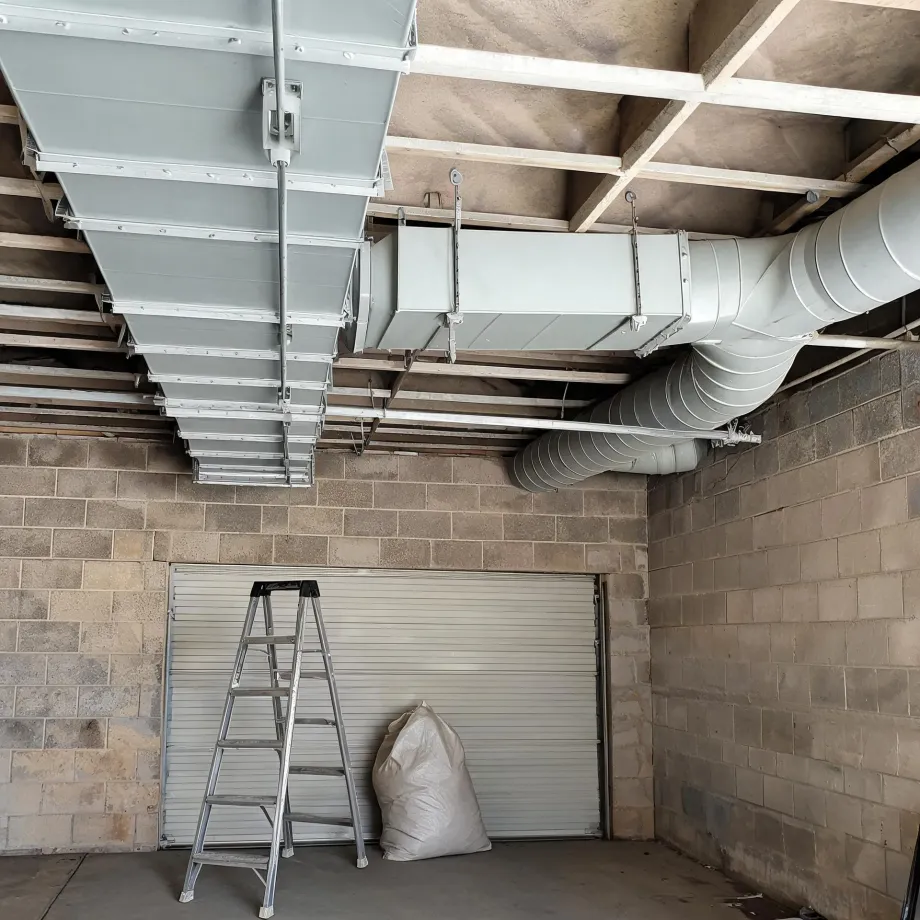
Ductwork installed for a previous generation of equipment carries assumptions about airflow and load that a heat pump does not share. Half the homes in Walton County, Georgia were built in 1997 or earlier (2020-2024 ACS 5-year). A contractor quoting a heat pump installation here has to open the system and measure what is actually in place before a unit can be selected, because duct sizing that worked for the original equipment can limit what a new system delivers. The electrical service is a second check: panels from that period vary, and what a heat pump draws has to be confirmed against what the house actually has.
What a Heat Pump Installation Covers
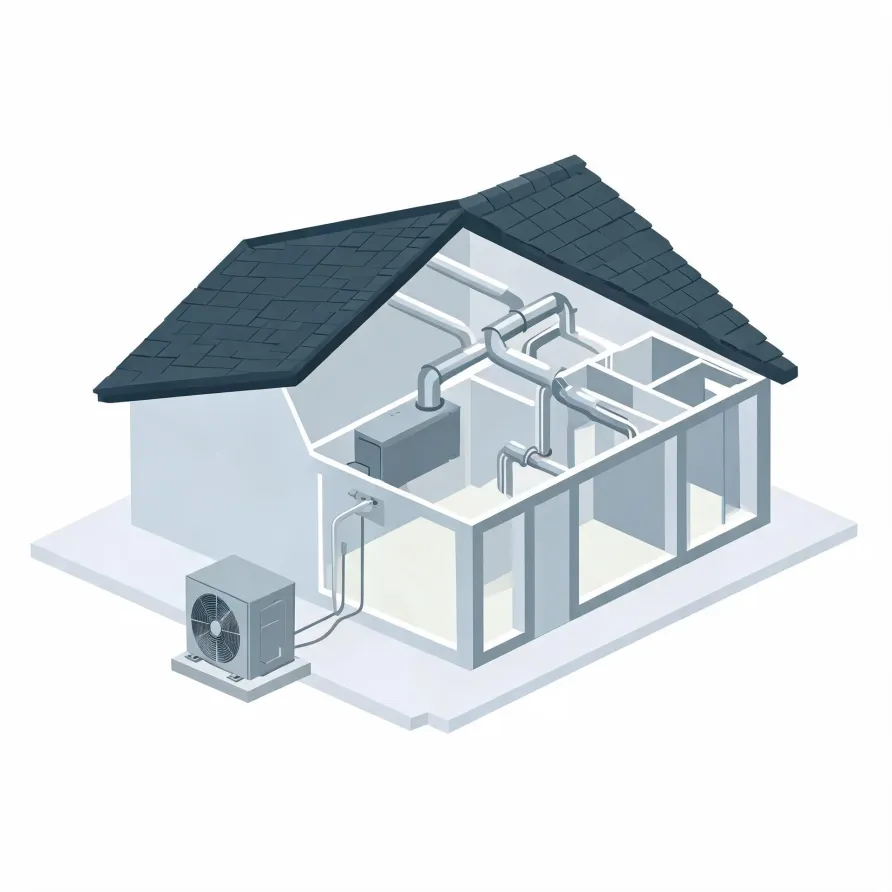
The outdoor unit sits on a concrete pad or wall bracket beside the house and holds the compressor and the main coil. Inside, an air handler mounts in a utility closet, attic, or basement and pushes conditioned air through the home. Together, these two units are what a contractor sets in place.
A refrigerant line set runs between the outdoor and indoor units, carrying the working fluid through insulated copper tubing along the exterior wall. A thermostat, mounted on an interior wall, is the control point the homeowner uses to set temperatures and, on many systems, to manage separate zones.
The drawing shows a typical layout, and a licensed contractor determines exactly what applies to your house.
Get matched in Walton CountyWalton County, by the numbers
191 severe weather events were recorded in Walton County, Georgia between 2015 and 2024.
NOAA National Centers for Environmental Information, Storm Events Database, bulk CSV export, events 2015-01-01 through 2024-12-31.Half the homes in Walton County, Georgia were built in 1997 or earlier (2020-2024 ACS 5-year).
U.S. Census Bureau, 2020-2024 American Community Survey 5-Year EstimatesWalton County, Georgia holds 37,468 housing units (2020-2024 ACS 5-year).
U.S. Census Bureau, 2020-2024 American Community Survey 5-Year EstimatesOwners occupy 79.3% of the occupied homes in Walton County, Georgia (2020-2024 ACS 5-year).
U.S. Census Bureau, 2020-2024 American Community Survey 5-Year EstimatesSevere Weather Events in Walton County
Weather puts a load on heating and cooling equipment, and that load varies by where you live. A heat pump sized and installed for local conditions handles the work that local conditions actually demand.
191 severe weather events, 2015–2024. Source: NOAA National Centers for Environmental Information, Storm Events Database.