Tell us about the job
Takes about a minute. No obligation.
A heat pump in Fulton County has been running against real weather load, and that shapes what a contractor finds when the system fails. 218 severe weather events were recorded in Fulton County, Georgia between 2015 and 2024. At that rate, cumulative stress on refrigerant lines, capacitors, and the compressor itself becomes a factor a contractor has to weigh before concluding what failed and why. A part that looks worn from age alone may have been driven to that point faster by sustained demand. So when a contractor quotes a repair here, the scope often reaches beyond the obvious symptom.
Half the homes in Fulton County, Georgia were built in 1993 or earlier (2020-2024 ACS 5-year). A heat pump sitting in a house built that long ago was almost certainly put in well after the structure was finished, and the electrical and refrigerant work it runs on reflects whoever did the retrofit, not the original build. When a contractor opens a system here, they are tracing decisions made at installation: whether the line set was sized right, whether the disconnect and wiring match what the unit actually draws, whether any earlier repair was done to spec. The age of the house sets none of that. What the opened equipment contains does.
The Parts of a Heat Pump a Contractor Checks First
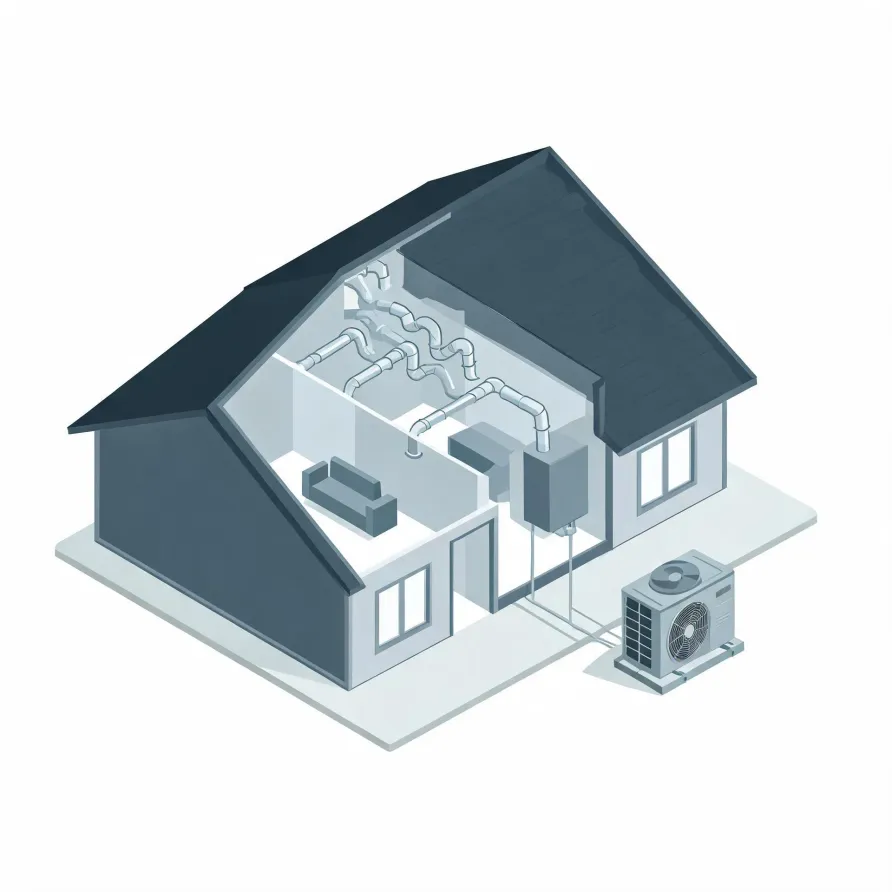
The outdoor unit is where most repair calls begin. It sits on a pad beside the house and holds the compressor, which moves refrigerant through the system, and the condenser coil, which releases or absorbs heat depending on the season. When either goes wrong, the whole system stops doing its job.
Inside the house, the air handler pulls air across the evaporator coil and pushes it through the home. The reversing valve, which tells the system whether to heat or cool, and the expansion valve, which regulates refrigerant flow, are the other pieces a contractor works through when the obvious suspects check out.
The drawing shows a typical layout, and a licensed contractor determines what applies to your specific system and home.
Get matched in Fulton CountyFulton County, by the numbers
218 severe weather events were recorded in Fulton County, Georgia between 2015 and 2024.
NOAA National Centers for Environmental Information, Storm Events Database, bulk CSV export, events 2015-01-01 through 2024-12-31.Half the homes in Fulton County, Georgia were built in 1993 or earlier (2020-2024 ACS 5-year).
U.S. Census Bureau, 2020-2024 American Community Survey 5-Year EstimatesFulton County, Georgia holds 507,119 housing units (2020-2024 ACS 5-year).
U.S. Census Bureau, 2020-2024 American Community Survey 5-Year EstimatesOwners occupy 54.3% of the occupied homes in Fulton County, Georgia (2020-2024 ACS 5-year).
U.S. Census Bureau, 2020-2024 American Community Survey 5-Year EstimatesSevere Weather Events in Fulton County
Weather puts heat pumps to work. Every storm, temperature swing, or stretch of hard weather pulls on the equipment, and in Fulton County that workload shapes how often repair needs come up and how quickly they do.
218 severe weather events, 2015–2024. Source: NOAA National Centers for Environmental Information, Storm Events Database.