Tell us about the job
Takes about a minute. No obligation.

A heat pump installation in Fayette County calls for sizing that fits what the climate actually delivers, and the weather record here gives a contractor something concrete to work from. 87 severe weather events were recorded in Fayette County, Georgia between 2015 and 2024. At roughly that pace, severe weather is a recurring fact of equipment life in this area rather than a rare one, but it falls well short of the relentless load that would force every installation decision around storm resilience alone. What a contractor has to get right is the balance: a system sized and installed for the real seasonal demand, with components chosen to handle periodic stress without being specified as if the county were in a far harsher corridor.
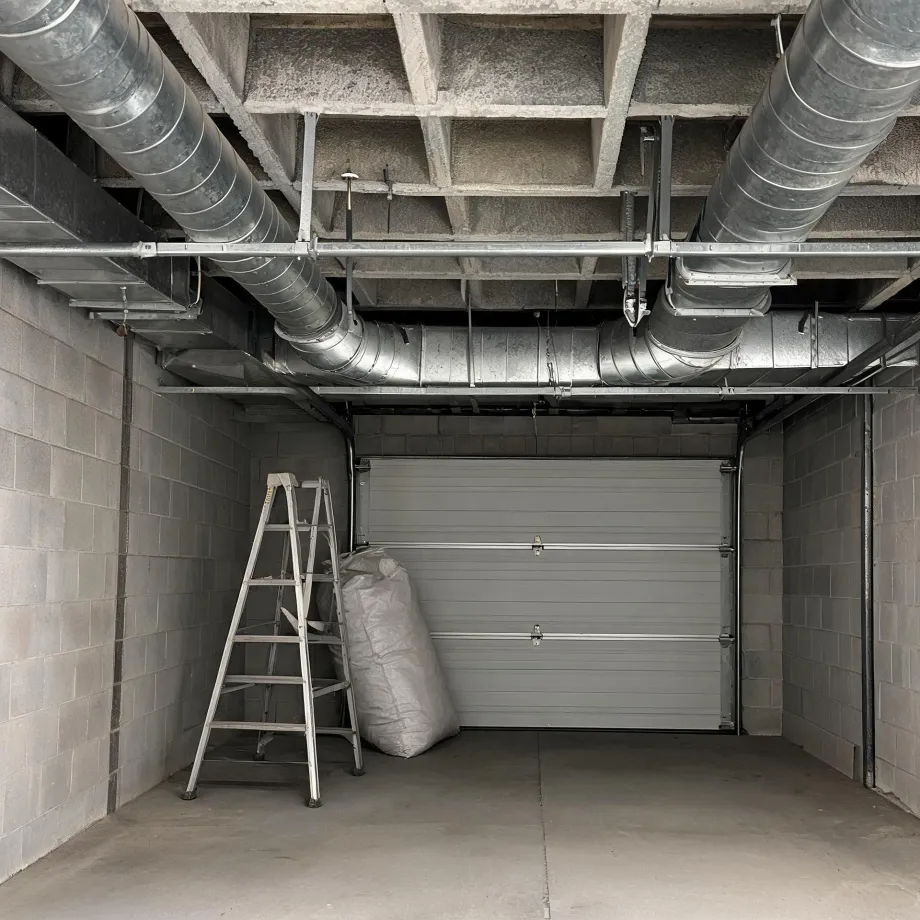
Ductwork and electrical service are what decide how a heat pump installation goes here, and both were put in before heat pumps were the obvious choice for this market. Half the homes in Fayette County, Georgia were built in 1993 or earlier (2020-2024 ACS 5-year). Wiring that was sized for something else may not carry what a new heat pump draws, and a contractor has to check the panel before pricing the rest of the job. The ductwork gets the same look, because what fit an older system does not automatically fit a new one.
What a Heat Pump Install Puts in Your Home
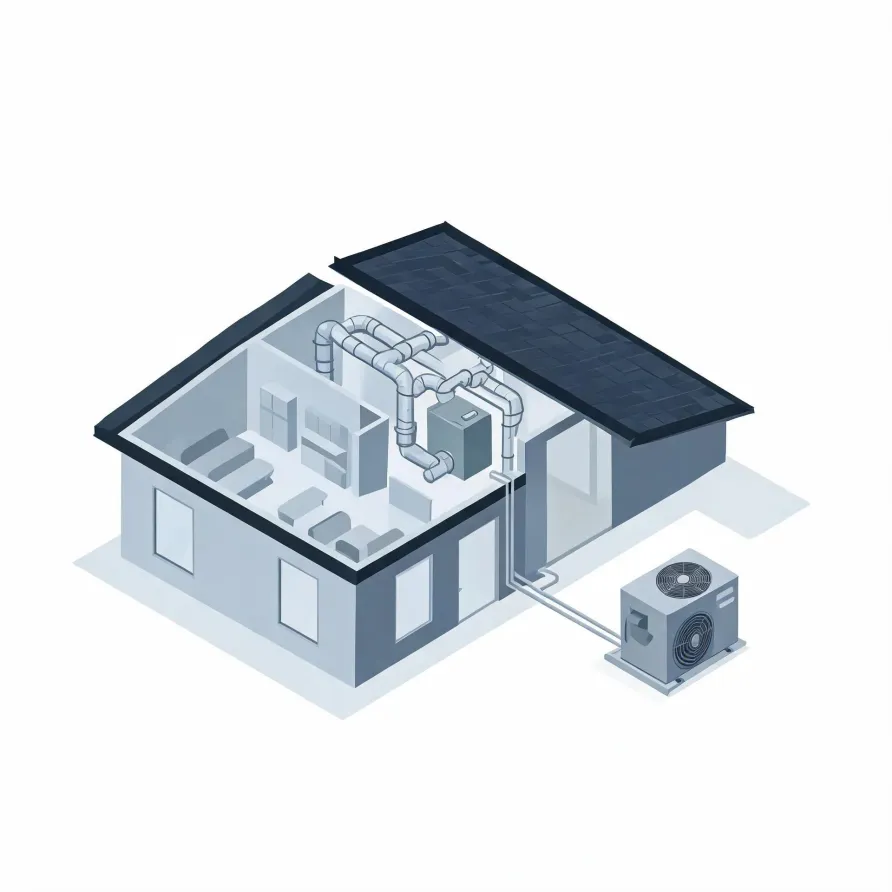
The outdoor unit sits on a pad beside the house and holds the compressor and one set of coils. The indoor air handler mounts inside, most often in a utility closet, attic, or basement, and pushes conditioned air through the home. Together these two cabinets make up the core of the system.
A refrigerant line set runs between the two units, carrying the working fluid that lets them exchange heat. A thermostat on an interior wall gives the homeowner control over the whole system, and a condensate drain line carries moisture from the air handler to the outside.
The drawing shows a typical layout, and a licensed contractor determines exactly how each piece fits the conditions in your house.
Get matched in Fayette CountyFayette County, by the numbers
87 severe weather events were recorded in Fayette County, Georgia between 2015 and 2024.
NOAA National Centers for Environmental Information, Storm Events Database, bulk CSV export, events 2015-01-01 through 2024-12-31.Half the homes in Fayette County, Georgia were built in 1993 or earlier (2020-2024 ACS 5-year).
U.S. Census Bureau, 2020-2024 American Community Survey 5-Year EstimatesFayette County, Georgia holds 46,453 housing units (2020-2024 ACS 5-year).
U.S. Census Bureau, 2020-2024 American Community Survey 5-Year EstimatesOwners occupy 80.1% of the occupied homes in Fayette County, Georgia (2020-2024 ACS 5-year).
U.S. Census Bureau, 2020-2024 American Community Survey 5-Year EstimatesSevere Weather Events in Fayette County
Heating and cooling loads are shaped by what the local climate actually does, not just its averages. A heat pump sized and installed for the conditions here has to account for the full range of weather this county sees.
87 severe weather events, 2015–2024. Source: NOAA National Centers for Environmental Information, Storm Events Database.